Less Carbon.
A sustainability-focused web project that estimates a user's carbon footprint through an interactive lifestyle survey and presents the result with category breakdowns, comparisons, and reduction guidance.
TÜBİTAK 4006 · High School Project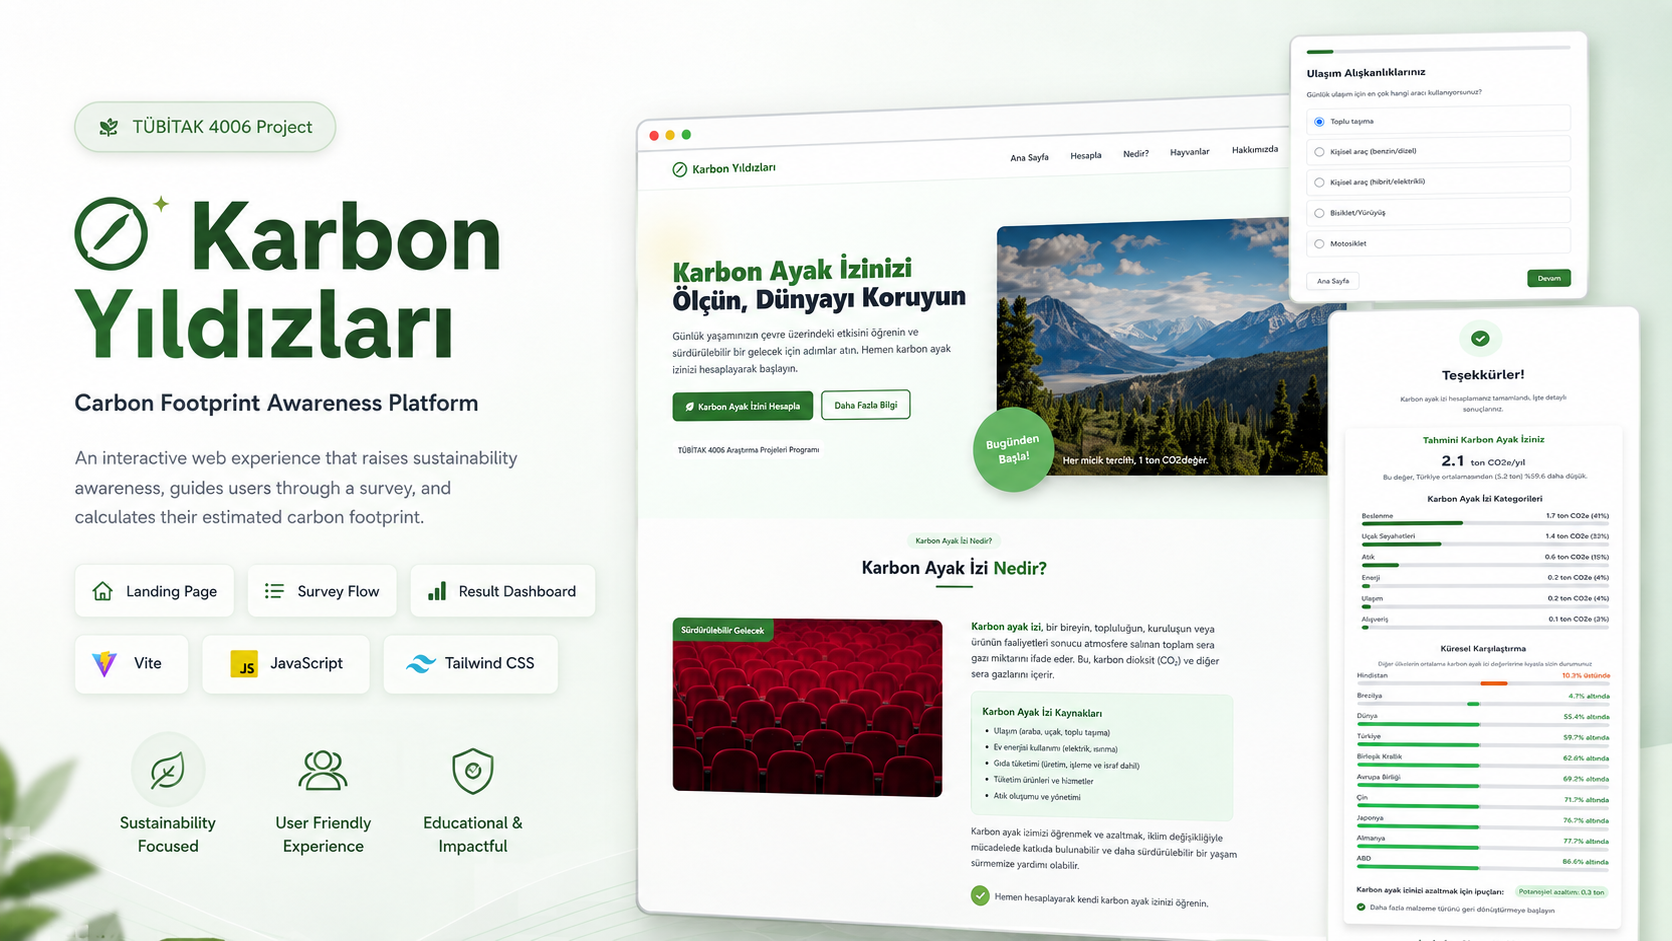
- 01 · Role
- Web development · UI implementation · Calculation logic
- 02 · Platform
- Responsive Web
- 03 · Period
- 10th Grade · TÜBİTAK 4006
- 04 · Status
- TÜBİTAK 4006 · High School Project
Project context
Less Carbon is a carbon-footprint awareness project I developed in 10th grade for TÜBİTAK 4006. Users first arrive at an educational landing page introducing carbon footprints, sustainable living, and environmental impact. They can then continue to a 10-step assessment covering areas such as transportation, diet, and everyday lifestyle habits. JavaScript-based calculation logic turns those responses into an estimated annual carbon-footprint value, while the result page presents total CO₂e, category breakdowns, comparisons with country and regional averages, and practical reduction suggestions. I independently developed the frontend, user interface, interactions, and calculation flow of the project.
Core challenge
The main challenge was turning a topic that can feel abstract and data-heavy into a simple, understandable, and interactive digital experience. Instead of presenting users with one long form, the assessment needed to guide them through a clear step-by-step survey, reliably transfer each response into the calculation logic, and transform the final number into something more useful through category breakdowns, comparisons, and actionable suggestions. Maintaining visual consistency across the landing, survey, and result experiences while keeping the interface responsive and fluid was equally important.
What I built
- 01
Developed the core product experience across the landing page, 10-step survey, and detailed result page.
- 02
Designed and implemented the complete journey from starting the carbon-footprint assessment to receiving the final result.
- 03
Built the client-side JavaScript logic that evaluates survey responses and calculates an estimated annual carbon-footprint value.
- 04
Calculated and visualized the contribution of impact categories including transportation, energy, diet, waste, air travel, and shopping.
- 05
Implemented result comparisons that position the calculated footprint against selected country and regional averages.
- 06
Built the result experience that provides reduction suggestions based on the calculated footprint.
- 07
Developed a guided survey interface with step indicators, a progress bar, selection states, and forward/back navigation.
- 08
Created a responsive sustainability-focused visual system with Tailwind CSS.
- 09
Used Framer Motion to add smoother page and content transitions, entrance animations, and interaction feedback throughout the experience.
- 10
Built educational landing-page sections covering carbon-footprint awareness, animals and ecosystems, and information about the project.
- 11
Published the project on Netlify, turning the TÜBİTAK 4006 work into a publicly accessible live web application.
Technical approach
The project was built with Vite, JavaScript, Tailwind CSS, and Framer Motion using a fully client-side architecture. The experience is organized into three major stages: an educational landing page, a 10-step carbon-footprint survey, and a detailed result page. Survey responses are maintained in the frontend and evaluated through JavaScript functions, where each selected option contributes to an estimated annual CO₂e value. The final result is presented not only as a total but also as category-level contributions for transportation, energy, diet, waste, air travel, and shopping, together with visual progress indicators and comparisons against selected country and regional averages. Tailwind CSS handles responsive layout, typography, spacing, and UI states, while Framer Motion adds transitions, entrance animations, and micro-interactions between screens and content states. The application does not depend on a backend, user accounts, or a database; survey state, estimation, and result generation all run directly in the browser.
System structure
- 01
Frontend
Vite · JavaScript - 02
Styling
Tailwind CSS - 03
Motion
Framer Motion - 04
Flow
Landing · 10-Step Survey · Result - 05
Calculation
Client-side Carbon Estimation - 06
Result
CO₂e · Categories · Comparisons · Tips - 07
Deployment
Netlify
Current state
The project is complete and publicly accessible through Netlify. Users can start the carbon-footprint assessment from the landing page, complete the 10-step survey, and receive an estimated annual CO₂e result together with category breakdowns, global comparisons, and reduction suggestions. Developed in 10th grade for TÜBİTAK 4006, it is one of my earlier web projects and one of my first attempts to turn a sustainability topic into a complete, functional, and visually polished digital product.